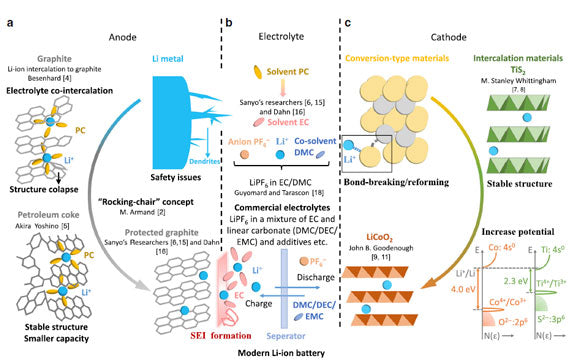
The electrolyte is one of the four main materials of the Li-ion battery, which has an important influence on gas production during the overcharge of the Li-ion battery. Choosing a suitable electrolyte formulation can continuously repair the SEI breakage of the battery during the cycle and maintain the structural stability of the electrode material, thus maintaining the cell capacity and kinetic performance. To enhance the safety of electrolyte during use from the perspective of solvent, lithium salt and additives is an important direction of electrolyte research at present. Since each electrolyte component has its electrochemical reaction potential, if the potential is reached, an electrochemical reaction will occur, accompanied by a certain amount of gas generation, resulting in cell volume expansion and even explosion.1-3 The higher voltage of the battery during overcharge is more likely to cause the decomposition of solvents and additives in the electrolyte, resulting in gas generation, but different charging multipliers will have an impact on the gas generation starting potential and gas generation volume. In this paper, an in-situ volume monitor (GVM) was used to test the in-situ overcharge volume of lithium cobaltate/graphite cells (theoretical capacity 1000 mAh) under different charging multiplier conditions (0.5C/1.0C/2.0C/3.0C) to compare and analyze the cell gas production behavior.
Test equipment and test methods
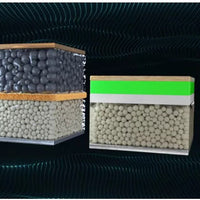
1. Experimental equipment: Model GVM2200 (IEST), test temperature range 20 ℃ ~ 85 ℃, support dual-channel (2 cells) synchronous testing, equipment appearance as shown in the figure.
2. Test method: Initial weighing of the Core m0, put the core to be tested into the corresponding channel of the device, open the MISG software, set the corresponding core number and sampling frequency parameters of each channel, the software automatically reads the volume change, test temperature, current, voltage, capacity, and other data.
In-situ monitoring of Li-ion cell overcharge gas production behavior
1. Analysis of charging and discharging curves and volume change curves
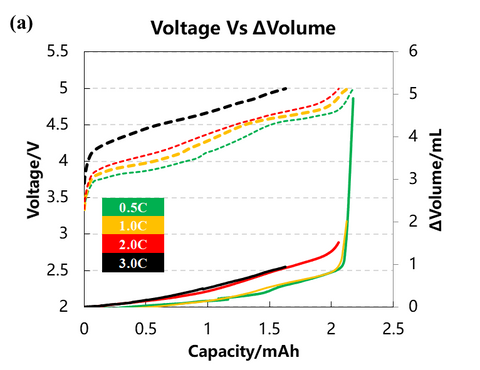
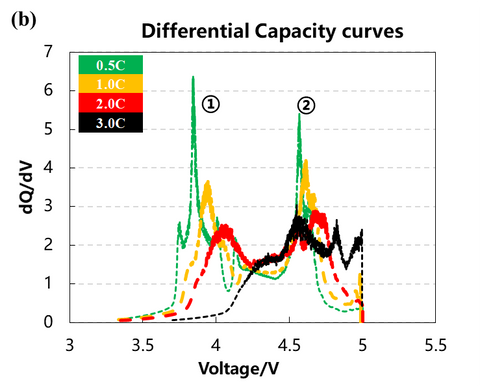
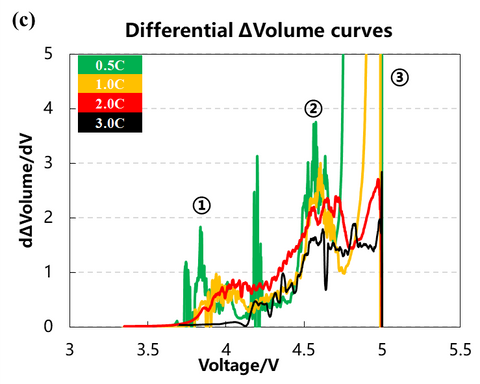
The volume change curves of the cell with voltage and differential capacity curves are shown in Fig. (a)(b)(c). The volume change curves of 0.5C and 1.0C will show an obvious inflection point when the voltage is close to 5V, and the volume of gas production will increase sharply. From the differential volume curves in Fig. (b), it can be seen that the peak positions of the two groups of de-embedded lithium at position ① and position ② gradually shift to the right as the charging multiplicity increases, indicating that the polarization gradually increases. Figure (c) shows the curves of the volume change volume curves after differentiating the voltage, and it can be seen that there are about three peaks of gas production, while the two sets of curves at 2.0C and 3.0C have almost no obvious peaks at position ③.
2. Cell capacity and gas production voltage analysis
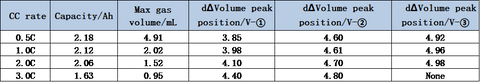
The charging capacity of the cell and the inflection point voltage of the gas production curve at different multipliers are shown in the table and figure. As the charging multiplier increases, the charging capacity of the cell gradually decreases, and the decay rate of the capacity increases when the multiplier increases from 2C to 3C. The gas production curve of the cell shows that the gas production at a small multiplier of 0.5C is significantly larger than that corresponding to a multiplier of 1C or higher. Comparing the capacity decay curve and the gas yield decay curve, it can be seen that the main reason for the decay of the cell capacity with the increase of the charging multiplier is not the increase of the gas yield, but possibly the increase of the cell polarization due to the increase of the multiplier, which makes the lithium-ion de-embedding more difficult. The differential curves of the volume change show that the voltage of the three gas production peaks shifts to the right with the increase of the multiplier, and the third gas production peak does not appear when the multiplier is 3.0C, which indicates that the increase of the core polarization raises the decomposition voltage of the electrolyte components and makes the overall gas production of the coreless.
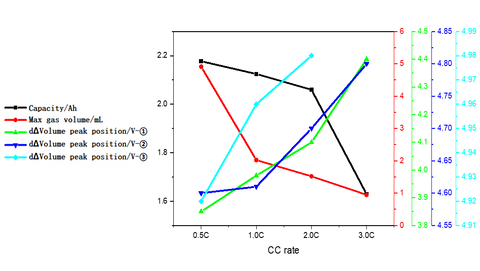
A temperature-controlled dual-channel in-situ gas production volume monitor is used to monitor the gas production behavior of Li-ion cells under different multiplier overcharge conditions. It can be found that as the charging multiplier increases, the capacity of the cells decreases, the gas production volume decreases, and the gas production starting voltage increases.


0 comments